My Python Debug Cheatsheet
Output:
Logging
Basic
import logging
logging.basicConfig(filename = 'a.log')
log = logging.getLogger()
log.error('Some error')
cat a.log:
More Config
import logging
# DEBUG, INFO, WARNING, ERROR, CRITICAL
log_level = logging.INFO
logging.basicConfig(filename = 'b.log',
    level=log_level,
    filemode='w', # or 'a'
    format='%(asctime)s %(levelname)s: %(message)s',
    )
log = logging.getLogger()
log.info('Some info log')
log.debug("Won't print at INFO level")
cat b.log:
Multiple Log Files
Use different logger names for different log files.
import logging
log_level = logging.INFO
def create_logger(filename, logname=''):
    handler = logging.FileHandler(filename)
    formatter = logging.Formatter(
        '%(asctime)s %(levelname)s: %(message)s'
        )
    handler.setFormatter(formatter)
    log = logging.getLogger(logname)
    log.setLevel(log_level)
    log.addHandler(handler)
    return log

# 1st log file
log1 = create_logger('a.log','app1')
log1.info('app1 info')
# 2nd log file
log2 = create_logger('b.log','app2')
log2.error('app2 error')
cat a.log:
cat b.log:
ipdb
Breakpoint in file
ipdb is an enhanced version of pdb (built-in). It supports all pdb commands and is simply easier to use like tab for auto-complete.
ipdb command cheatsheet. Check here for more commands.
n[ext]:         next line, step over
s[tep]:         step into next line or function.
c[ontinue]:     continue
until [lineno]: continue execution until a line with a number greater or equal to lineno is reached
l[ine]:         show more lines
q[uit]:         quit debugging
help:           show all commands
help <command>: help of a command
Use ipdb.set_trace() to set a breakpoint. For example:
Run python a.py:
$ python a.py
> /home/peter/a.py(4)<module>()
      3 ipdb.set_trace()
----> 4 b = 2
      5 r = a / b

ipdb> n
> /home/peter/a.py(5)<module>()
      3 ipdb.set_trace()
      4 b = 2
----> 5 r = a / b

ipdb> print(b)
2
ipdb cli
You can also debug your code without setting breakpoints in the file by:
# Start to execute from 1st line of the code a.py
# and you can use n or other ipdb commands to continue.
python -m ipdb a.py

# Start debug and pause at line 10
python -m ipdb -c 'until 10' a.py

# Don't exit the program on Exception and enter debug mode instead
# If no Exception, it finishes the program once and restarts at 1st line
python -m ipdb -c 'continue' a.py
Interactive Mode (Not Recommended)
Running a script in interactive mode is similar to python -m ipdb -c 'continue' a.py. Python does not exit after an Exception.
Run with -i:
python -i a.py
Traceback (most recent call last):
  File "a.py", line 5, in <module>
    divide(1,b)
  File "a.py", line 2, in divide
    return a / b
ZeroDivisionError: division by zero
>>> b
0
>>>
But it is not the same exactly. Check the following example.
Interactive mode:
$ python -i a.py
Traceback (most recent call last):
  File "/home/peter/repo/mqtt_client/a.py", line 7, in <module>
    divide(1,b)
  File "/home/peter/repo/mqtt_client/a.py", line 4, in divide
    ret = a / b
ZeroDivisionError: division by zero
>>> print(b)
0
>>> print(ret)
Traceback (most recent call last):
  File "<stdin>", line 1, in <module>
NameError: name 'ret' is not defined. Did you mean: 'set'?
In interactive mode, it will exit the current function with exception and you cannot debug where it failed, while
python -m ipdb -c 'continue' mode can.
ipdb mode (good):
$ python -m ipdb -c "continue" a.py
/usr/lib/python3.10/runpy.py:126: RuntimeWarning: 'ipdb.__main__' found in sys.modules after import of package 'ipdb', but prior to execution of 'ipdb.__main__'; this may result in unpredictable behaviour
  warn(RuntimeWarning(msg))
Traceback (most recent call last):
  File "/home/peter/Envs/mqtt/lib/python3.10/site-packages/ipdb/__main__.py", line 323, in main
    pdb._runscript(mainpyfile)
  File "/usr/lib/python3.10/pdb.py", line 1583, in _runscript
    self.run(statement)
  File "/usr/lib/python3.10/bdb.py", line 598, in run
    exec(cmd, globals, locals)
  File "<string>", line 1, in <module>
  File "/home/peter/repo/mqtt_client/a.py", line 7, in <module>
    divide(1,b)
  File "/home/peter/repo/mqtt_client/a.py", line 4, in divide
    ret = a / b
ZeroDivisionError: division by zero
Uncaught exception. Entering post mortem debugging
Running 'cont' or 'step' will restart the program
> /home/peter/repo/mqtt_client/a.py(4)divide()
      3     ret = None
----> 4     ret = a / b
      5     return ret

ipdb> print(b)
0
ipdb> print(ret)
None
Exception
Understand Exception
Run and you will get an exception as follows.
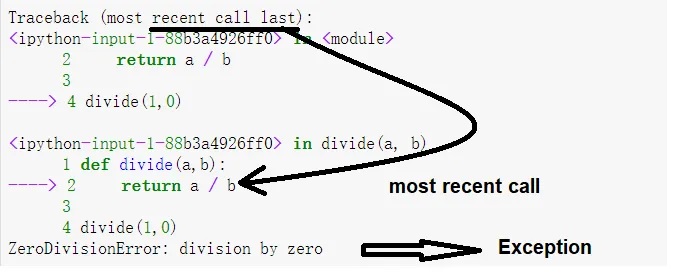
The last line is the exception or root cause in other words.
The above is the so-called traceback. It traces the source of the exception. The error occurs in line #4 divide(1,0), but the source is in line #2 inside the function divide and you see that at the bottom of the traceback.
Print Exception
It is a good practice to specify the Error, i.e. ZeroDivisionError, if you want what to capture, otherwise you can use generic except Exception as ex.
Output:
Print Full Traceback
import traceback
def divide(a,b):
    return a / b
try:
    divide(1,0)
except Exception:
    print(traceback.format_exc())
Output:
Traceback (most recent call last):
  File "<ipython-input-2-251e5476aec8>", line 6, in <module>
    divide(1,0)
  File "<ipython-input-2-251e5476aec8>", line 3, in divide
    return a / b
ZeroDivisionError: division by zero
Jupyter Notebook
Jupyter notebook is one of my favorite debugging tools. It is like a visual version of ipdb.
There is an implicit breakpoint after each cell (a block) of code. You can check/change variable values and continue with another block of code in the next cell.
Ctrl + Enter to run a cell.
VS Code Magic to Jupyter
Add #%% to an existing python file (.py) and you can run it as a Jupyter cell.
trace
The built-in trace module can print what lines are executed (similar to bash -x option) and the timing option is handy to debug performance issues on line level.
Example a.py:
Run with trace:
python -m trace -t --timing \
--ignore-dir=$(python -c "import sys,os; print((os.pathsep).join(sys.path[1:]))") \
a.py
Output:
 --- modulename: a, funcname: <module>
0.00 a.py(1): import time
0.00 a.py(2): print('line 1')
line 1
0.00 a.py(3): time.sleep(0.2)
0.20 a.py(4): if 1 == 1:
0.20 a.py(5):     print('ok')
ok
Notes: The ignore-dir parameter is set to not trace system paths, i.e. standard libraries.
VS Code F5?
VS code F5 Start Debugging is nice when it works, BUT it does not work for me most of the time. Note it uses debugpy under the hood.